Life cycle assessment for hydrodynamic bearings: How much CO₂ is embedded in a bearing? 

Customers, purchasing specifications, and regulatory requirements are no longer focused solely on price, lead time, and service life. Increasingly, another question is becoming part of the specification: What is the carbon footprint of this component? 

For hydrodynamic bearings used in wind turbines, we answered this question by conducting a comprehensive life cycle assessment of a bearing bushing used in a wind turbine gearbox. 


In this article, you will learn why the greatest lever for reducing carbon footprint is not where most people expect it. You will also learn: 

  • what a life cycle assessment is and what it can do for your application, 

  • which four factors determine the carbon footprint of a bearing, 

  • why comparisons per kilogram can be misleading, and 

  • what this means for bearing selection in wind turbines. 

What is a life cycle assessment? 


A life cycle assessment, or LCA, evaluates the environmental impacts of a product throughout its entire life cycle. It considers not only a company’s own manufacturing operations, but also raw material extraction, transportation, and the use phase. 


The process is defined in ISO 14040 and ISO 14044 and consists of four steps: defining the goal and system boundaries, compiling all inputs and outputs, translating them into environmental impacts, and interpreting the results. 

For climate-related assessments, the result is called the product carbon footprint, or PCF. It includes all greenhouse gas emissions along the value chain, expressed as CO₂ equivalents. 

One important practical consideration is that the standards define the process, but not the calculation methods. PCF values from two manufacturers can therefore be compared only if the system boundaries, functional unit, and data basis are disclosed. 

The life cycle assessment of a bearing bushing in practice 

The assessment examined an externally coated hydrodynamic bearing bushing for the planetary stage of a wind turbine gearbox. It is a series-production component with a steel backing and an aluminum-tin bearing layer. 

The analysis covered the process from raw material extraction to the finished bearing at the factory gate. 

The four biggest levers for reducing carbon footprint 

The PCF of the bearing bushing is approximately 3.3 kilograms of CO₂ per kilogram of bearing. Four factors determine this value: 


  • Steel production: The steel backing accounts for the largest share of the material. The proportion of secondary steel from recycling is a key factor. 

  • Aluminum production: The bearing layer is lightweight, but energy-intensive to produce. The source and production process of the primary aluminum have a significant impact. 

  • Electricity used in manufacturing: Milling, turning, welding, and cleaning require energy. The electricity mix at the manufacturing location is decisive. 

  • Transportation: Not only raw material deliveries, but also every external processing step adds transportation miles and therefore CO₂ emissions. 


The key takeaway is that carbon footprint is driven by materials, energy, and logistics, not by machining itself. To reduce it, companies need to focus on recycled content, electricity sourcing, material utilization, and the process chain. 


The scenarios analyzed show what is possible. By bringing external processing steps in-house, sourcing material closer to the required final dimensions, and changing the electricity mix, emissions can be reduced by approximately 40 percent without making a single change to the component. 

The values discussed so far relate to the bearing bushing itself. In practice, however, another question is critical: How meaningful is this value when compared with alternative bearing concepts? The carbon footprint of a single kilogram of material does not indicate the environmental impact of a complete bearing position. To put the results into context, the bearing must therefore be compared with a technically equivalent rolling element bearing solution.

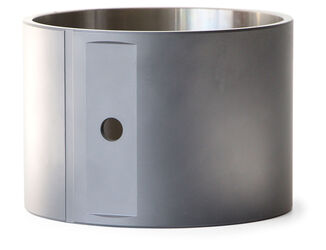
Hydrodynamic bearings vs. roller element bearings: Why comparisons per kilogram can be misleading 

On a per-kilogram basis, hydrodynamic bearings and rolling element bearings are similar. One rolling element bearing manufacturer reports values ranging from 1.8 to 5.4 kilograms of CO₂ per kilogram, with an average of 3.5 kilograms of CO₂ per kilogram. 


This could lead to the conclusion that the bearing type has no effect on carbon footprint. But one kilogram is not a function. 

A bearing must carry a defined load at a defined speed, within the available installation space, and throughout the service life of the system. Only a comparison based on equivalent functionality is meaningful

The same bearing position with one-tenth the mass 

For the planetary stage of a 6-megawatt gearbox, an equivalent rolling element bearing arrangement was therefore designed. 


The result: Where two hydrodynamic bearing bushings are sufficient, four rolling element bearings with approximately ten times the mass per bearing position are required. 

Across the complete planetary stage, manufacturing therefore generates approximately ten times less CO₂ with hydrodynamic bearings than with rolling element bearings, even though the value per kilogram is nearly identical. 


The reason is power density: Hydrodynamic bearings distribute loads across a surface rather than through localized contact points. Less material for the same function means lower CO₂ emissions. In wind turbines, it also means less installation space, lower weight in the nacelle, and lower structural requirements for the tower and foundation. 


The use phase also matters 

A life cycle assessment does not end at the factory gate. Over a 30-year operating life, every friction-related power loss adds up to energy that does not reach the grid. 


Viewed across the entire service life, the use phase therefore has a significantly greater impact than manufacturing. Even tenths of a percentage point in efficiency can have a greater effect than any optimization on the factory floor. 


Another factor is critical for wind power: The load-carrying capacity required of rolling element bearings increases disproportionately as loads rise. With limited installation space, a feasible design eventually becomes impossible. Higher power ratings can then be achieved only with hydrodynamic bearings, and every additional megawatt supplied to the grid has a greater impact than friction improvements in existing systems. For comparison, a wind turbine generates the energy required for its own production after approximately 2.5 months (Fachagentur Wind und Solar). 


What this means for your application 

The project provides four takeaways that apply to any carbon footprint assessment of a bearing position: 


  • Check the functional unit. A CO₂ value without defined system boundaries, a functional unit, and assumptions about use is not reliable. 

  • Evaluate the function, not the kilogram. The complete bearing position is what matters, not the individual component. 

  • Consider the use phase. Over the service life, efficiency is decisive, not manufacturing alone. 

  • Plan measurement capabilities early. Only companies that can measure consumption at the component level can provide customers with reliable PCF data. 

Conclusion: How Miba reduces carbon footprint 

The life cycle assessment shows that the carbon footprint of a hydrodynamic bearing is primarily generated by materials, energy, and logistics, and that it can be reduced significantly in these areas. 


The greater difference, however, comes from the design and targeted integration. Because hydrodynamic bearings require substantially less mass to perform the same function, the carbon footprint of a complete bearing position can be many times lower. When the design and integration are optimized, additional potential can also be realized during operation, improving overall system performance. 

For Miba, reducing CO₂ emissions is an essential part of sustainable business development. By expanding resource-efficient processes, optimizing material use and logistics, and increasing the use of sustainable energy sources, we continuously work to reduce the environmental footprint of our products. Life cycle assessments provide transparency and help us make sustainability measurable and understandable for our customers. 

Contact us now!